

Consumption and top-up records
Where your allowance went and when you topped up both sit in the lower half of Analytics → Usage Statistics. Two tabs: Usage history and Top-up history.
Usage history
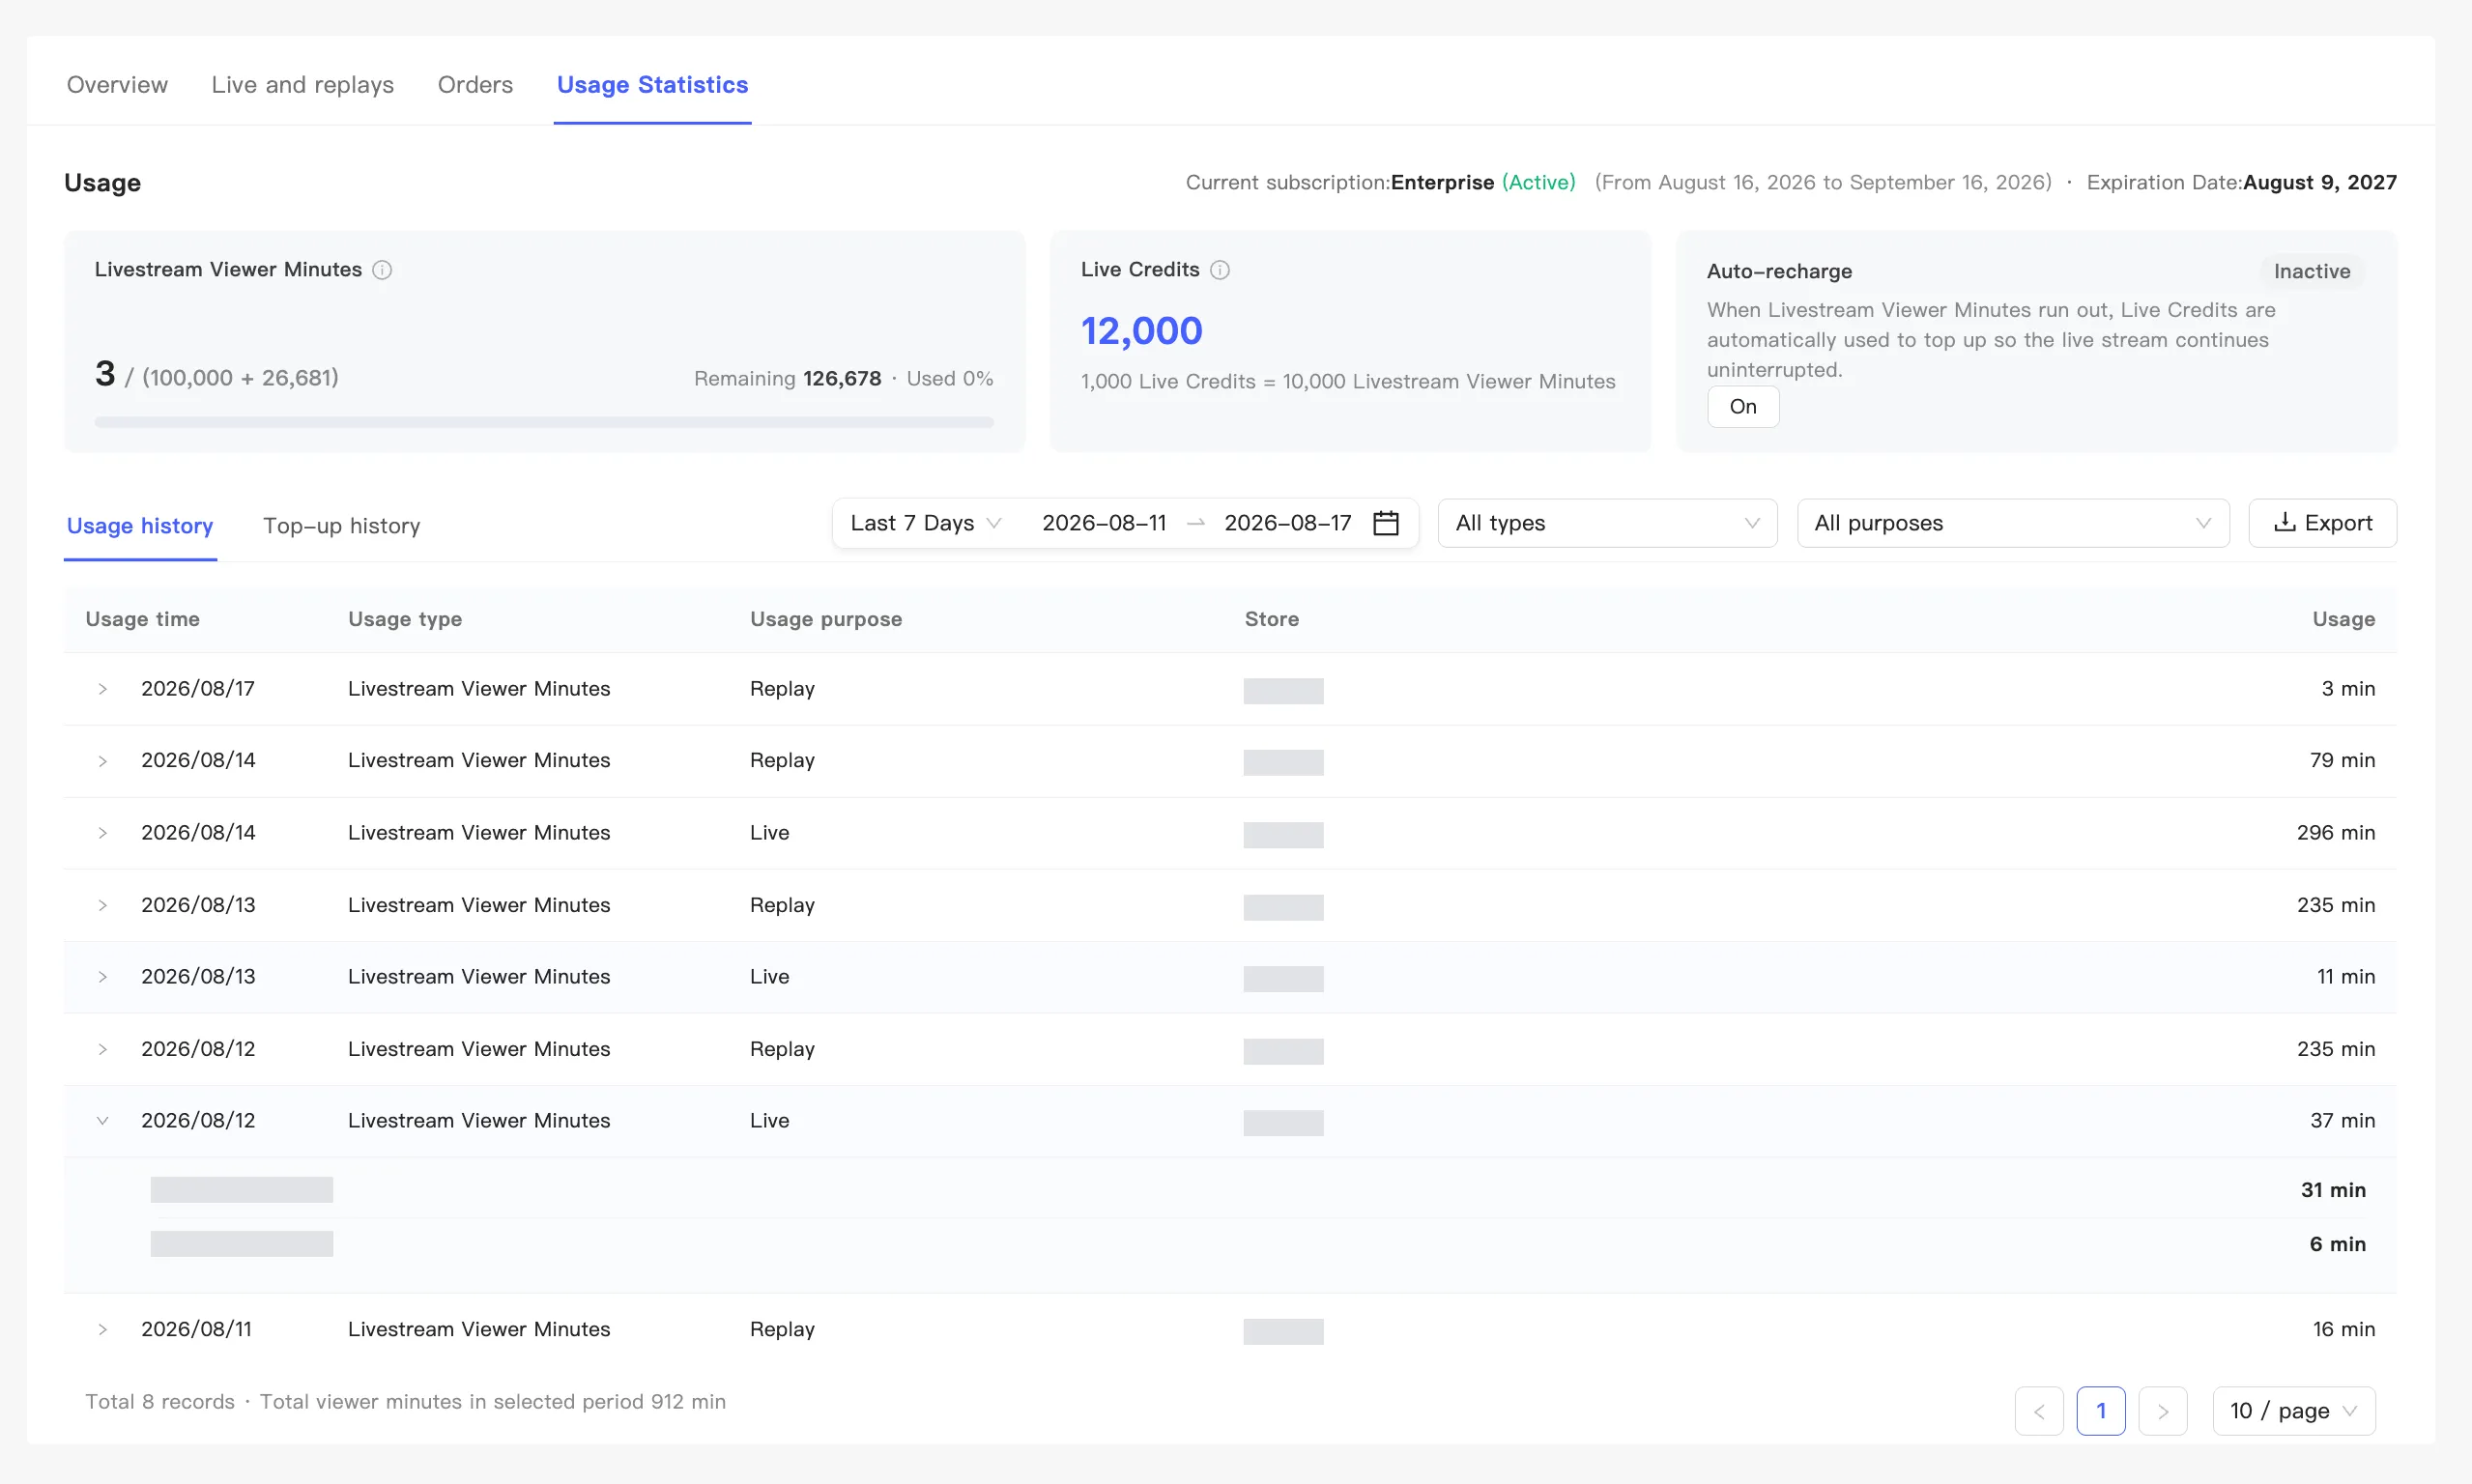
Section titled “Usage history”Each row is one day’s total for one kind of consumption. Five columns: Usage time, Usage type, Usage purpose, Store, and Usage.
The unit follows the type. Viewer minutes count in minutes, auto-recharge counts in Live Credits, and email counts in messages.
Rows expand. Click the arrow at the left of a row and it breaks the day down by event, showing which sessions consumed what. To find out what one broadcast cost in minutes, look here.
Filtering and export
Section titled “Filtering and export”Three sets of conditions in the toolbar:
- Date range — presets, or your own start and end dates.
- Usage type — filter by Livestream Viewer Minutes, Live Credits, and the rest.
- Usage purpose — filter by Live, Replay, auto-recharge, email, and the rest.
For Export on the right, see Export data.
The bottom of the table gives the record count, followed by the total viewer minutes within your current filters. That is the number to read when you want to know how many minutes a period used. Further right, set rows per page and move between pages.
Top-up history
Section titled “Top-up history”Switch to Top-up history for individual top-ups. Six columns: transaction number, store, type, amount in USD, payment method, and time.
Page through when there are many. With no purchases yet, the tab shows an empty state.
This tab has no filters and no export. The toolbar only renders under Usage history, and switching over drops it.