Live and replay performance
The Live and replays tab separates the two. The left side gives you four entry points: Performance and Details, under Live and under Replay.
Performance
Section titled “Performance”Four blocks, top to bottom:
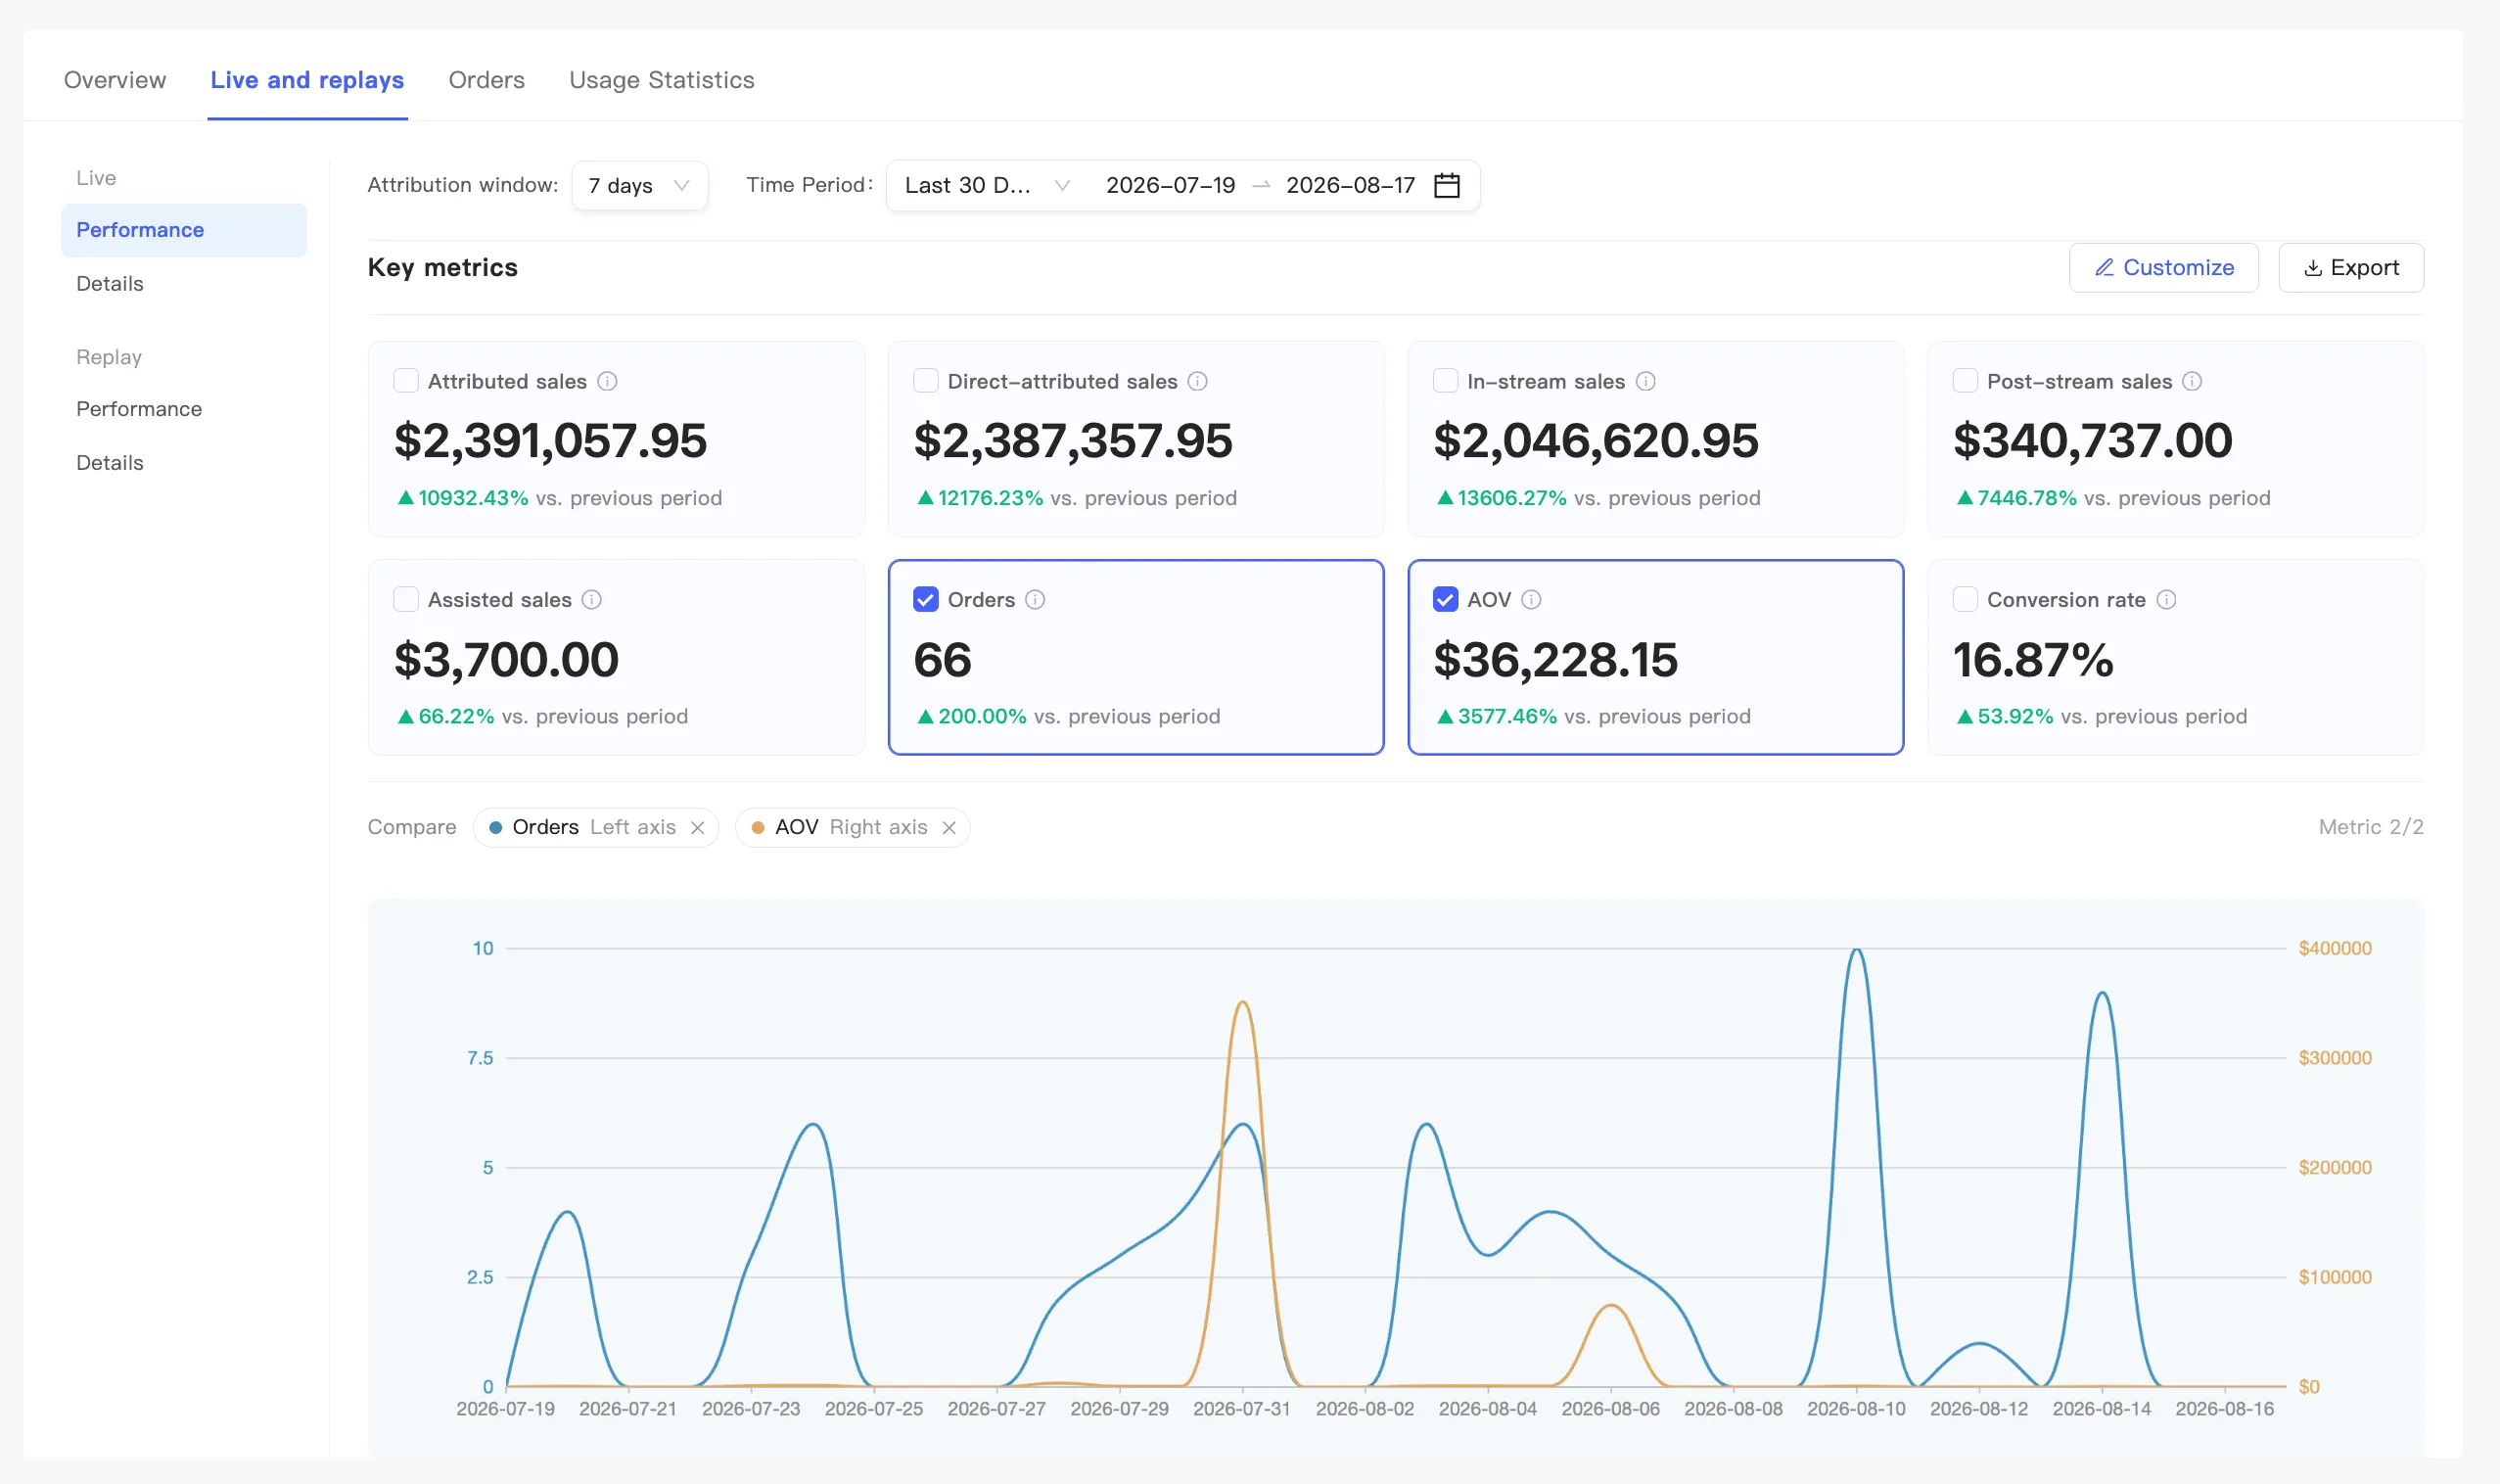
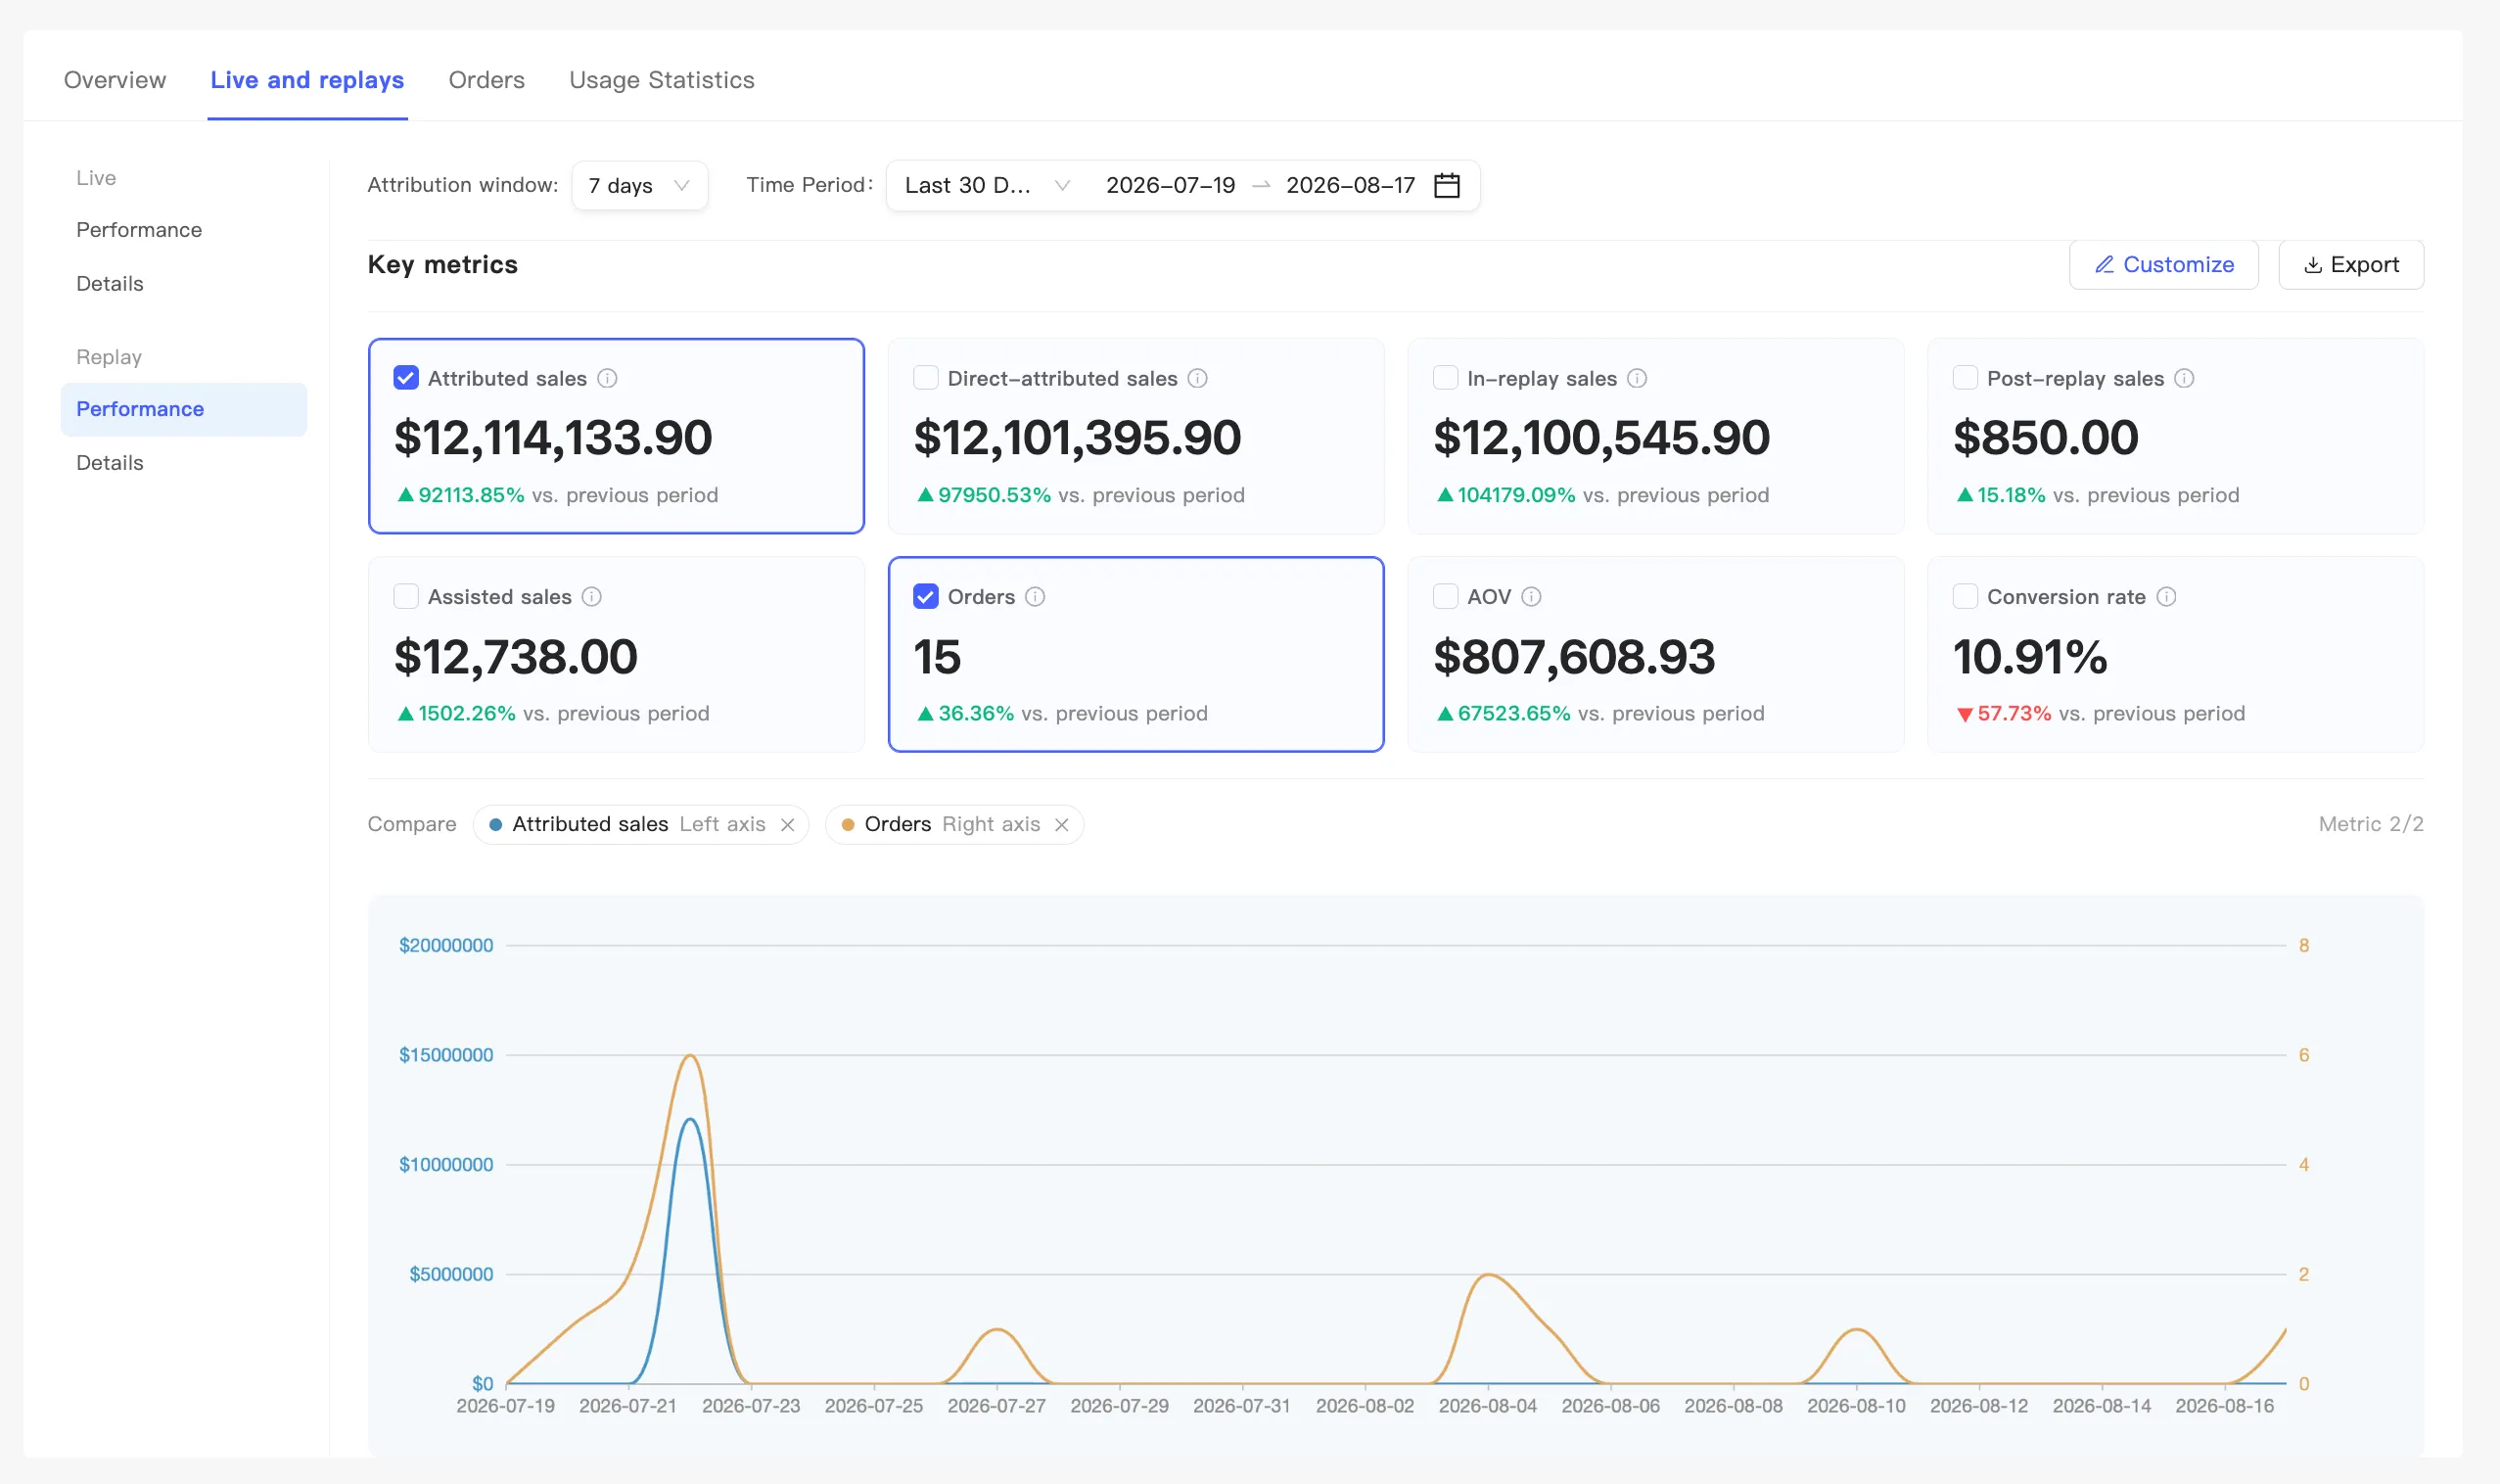
Key metrics and Conversion analysis — the same pair as the overview tab, with the data narrowed to live only or replay only. The cards customize, reorder, and plot two trends the same way. See Analytics overview.
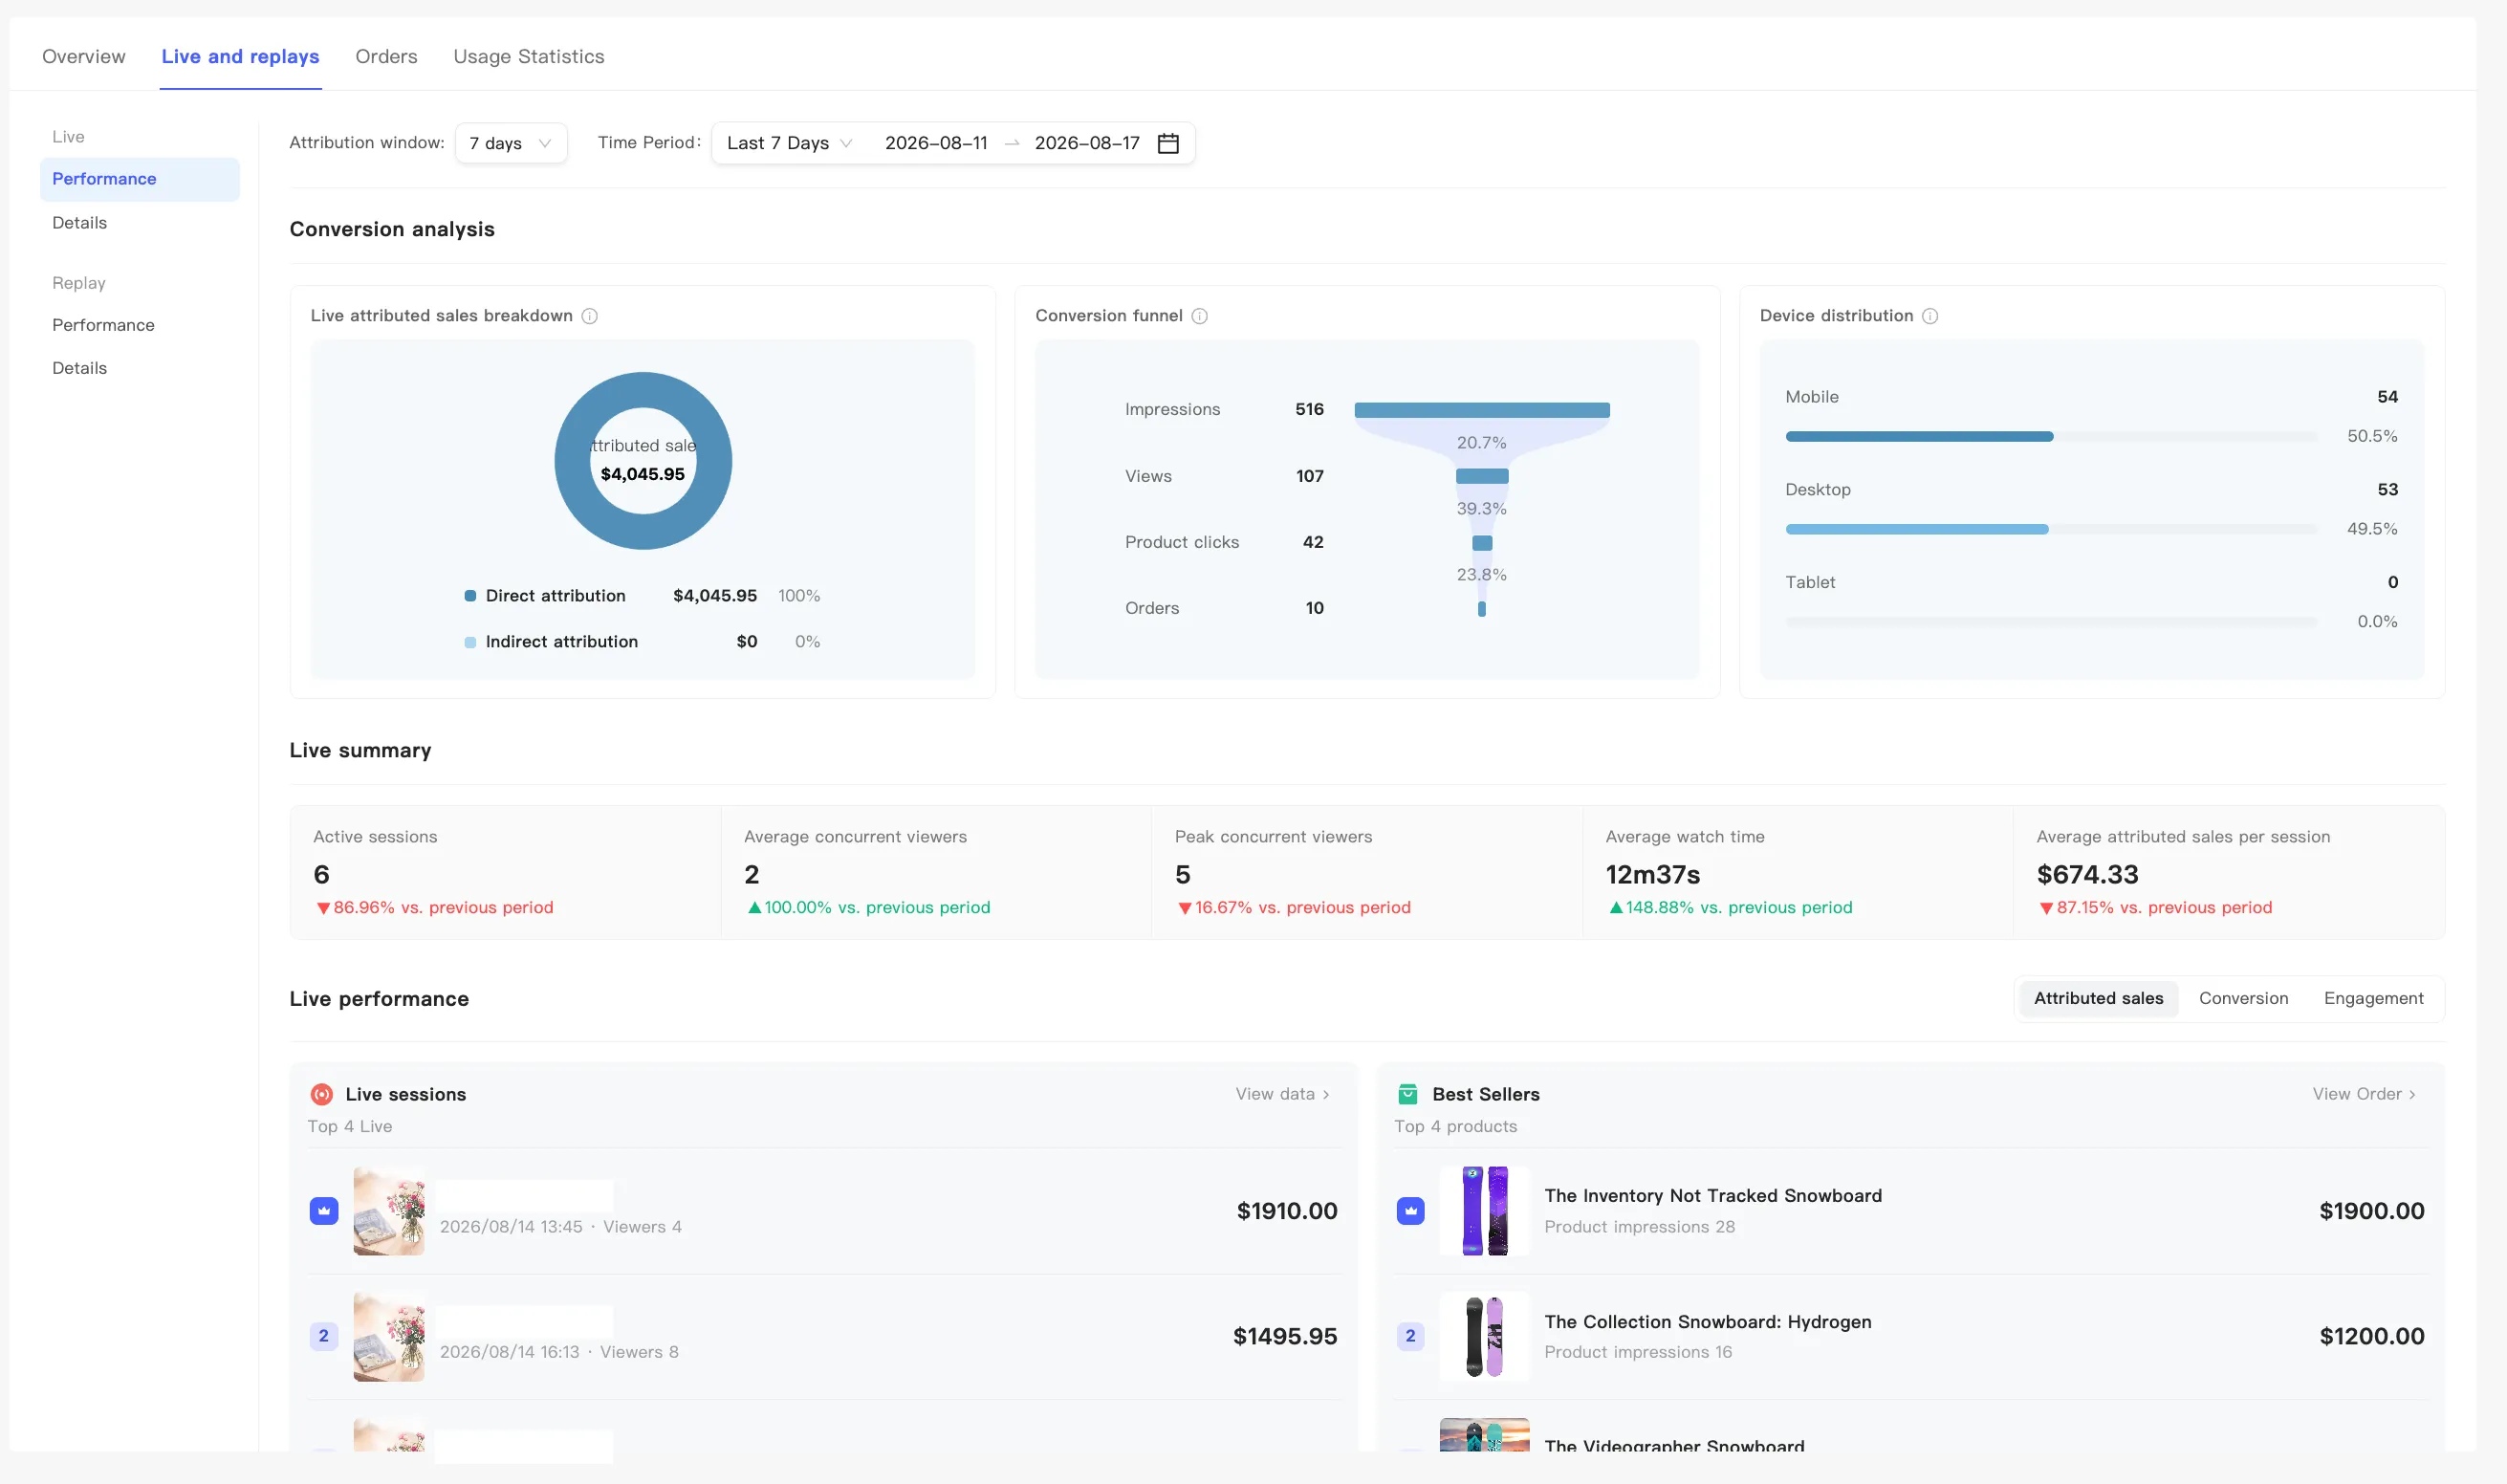
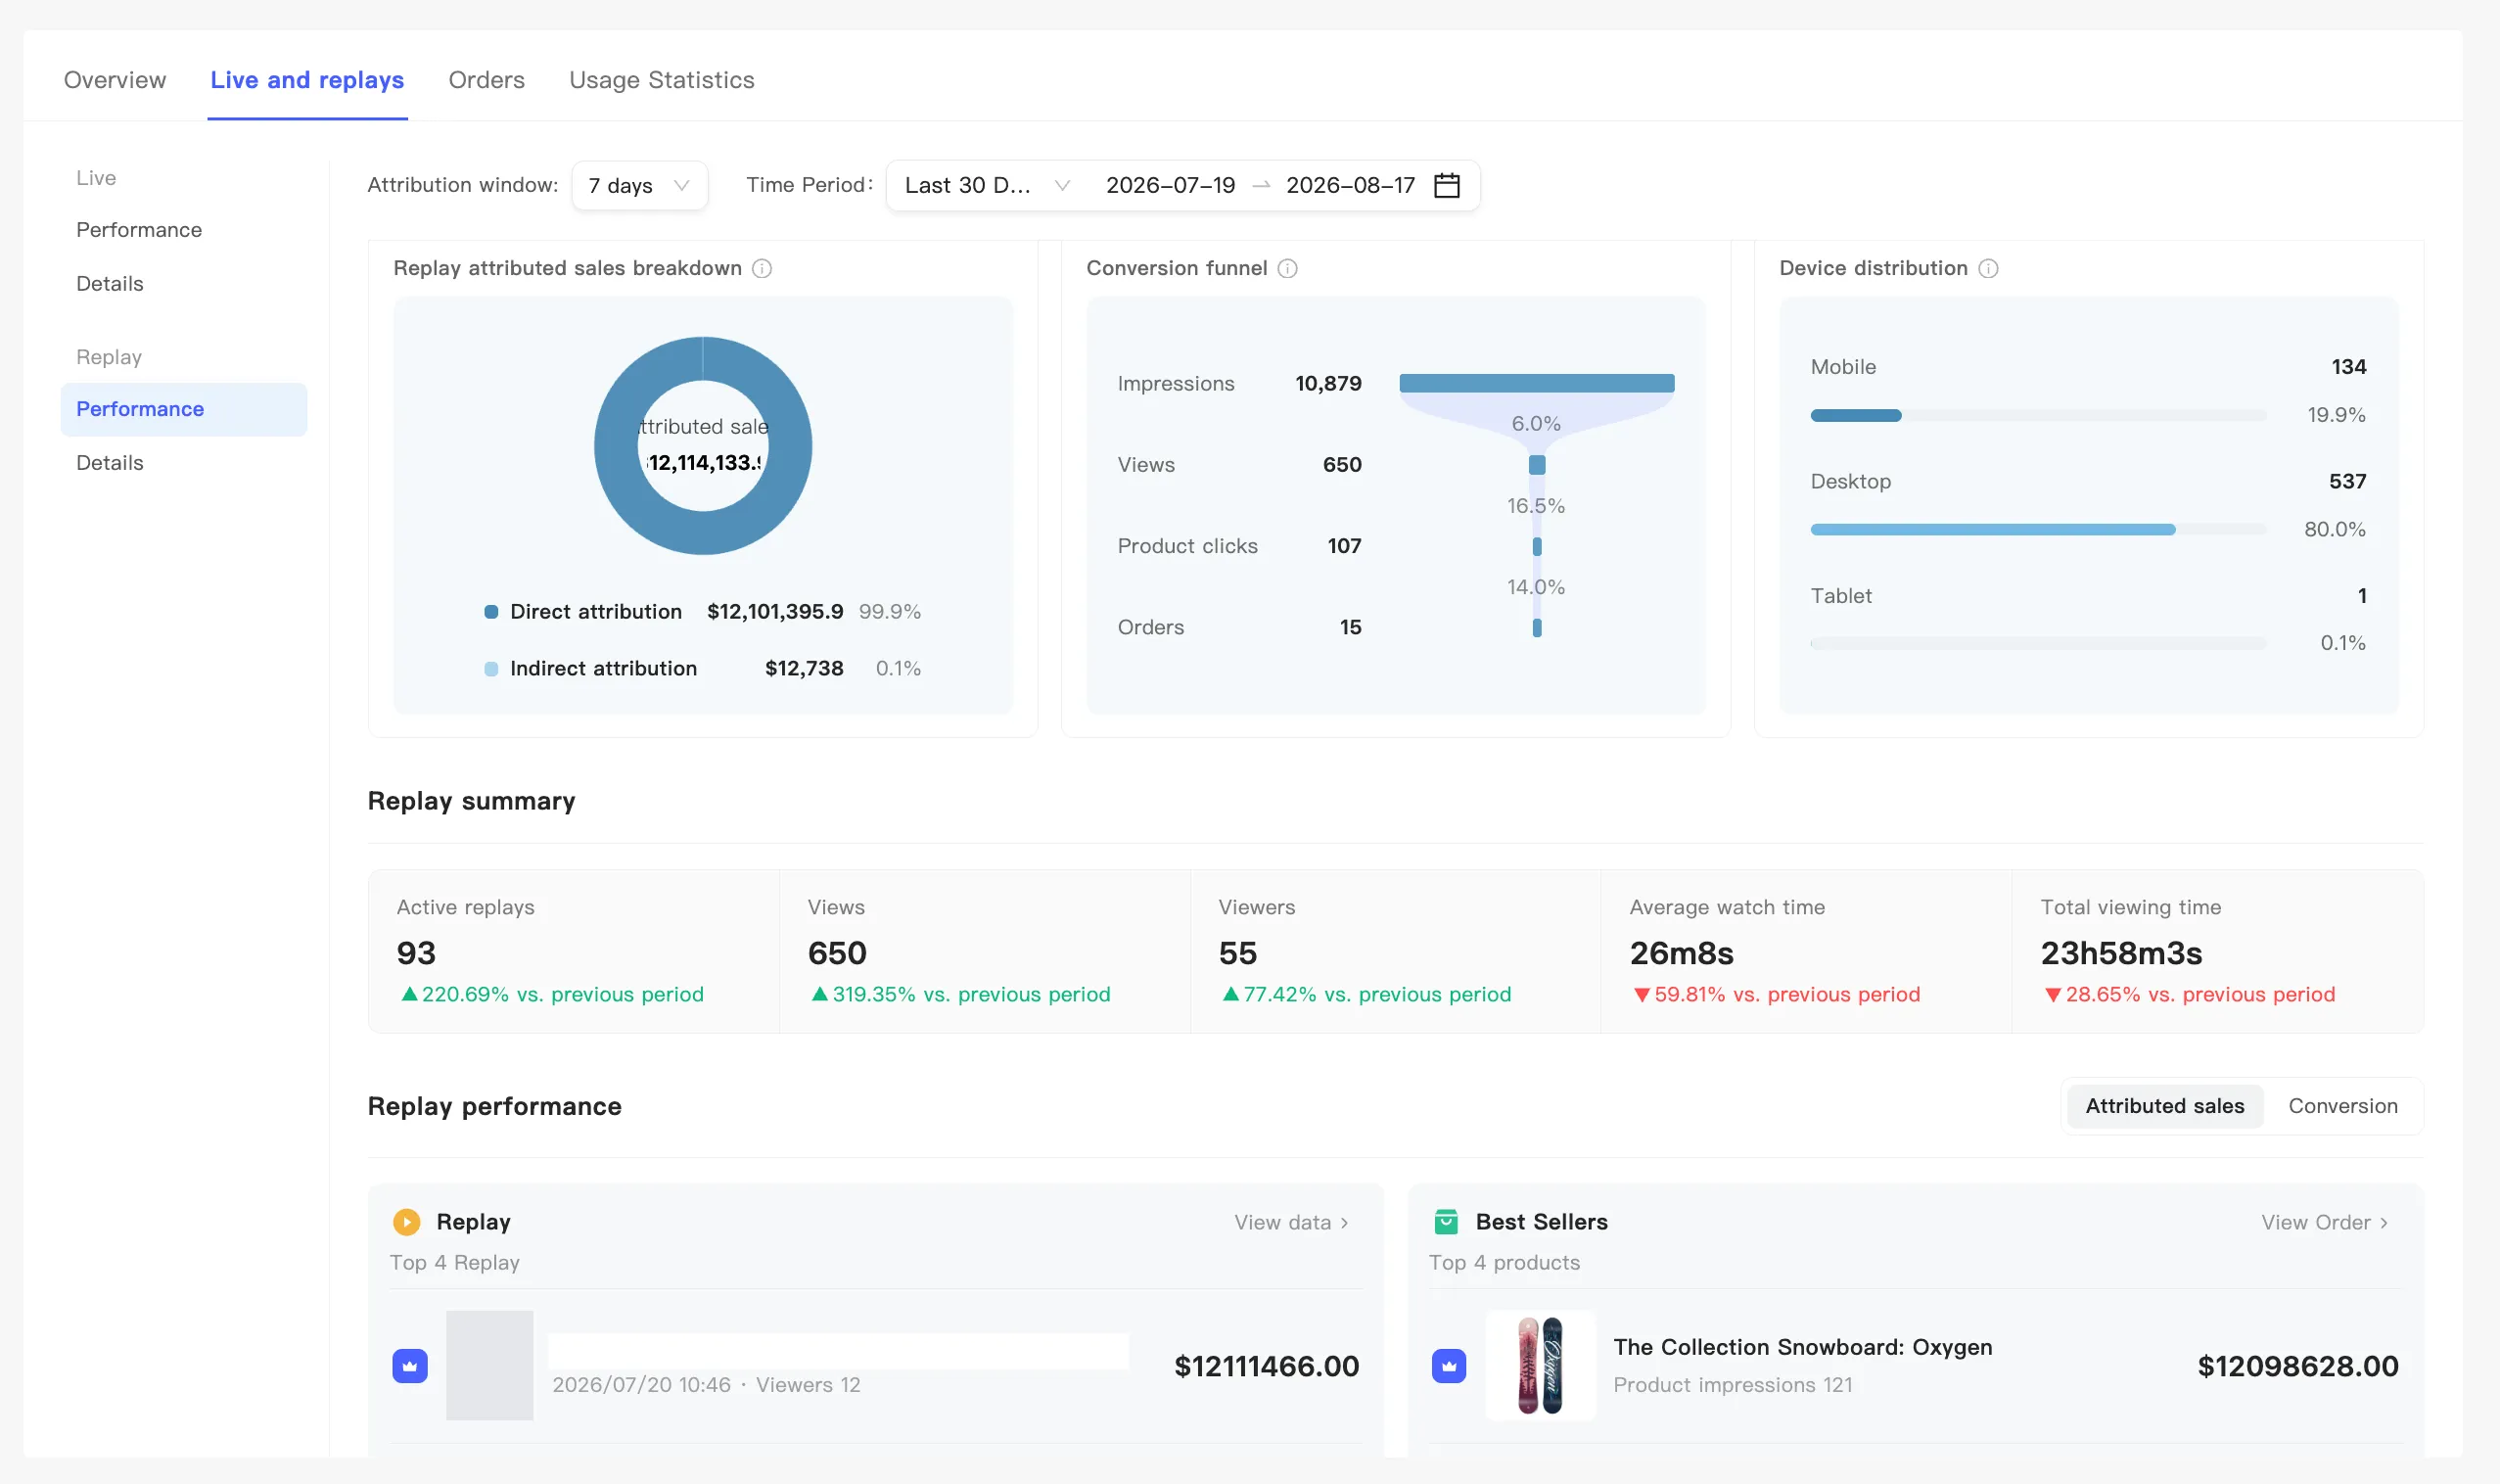
Live summary or Replay summary — five summary numbers, each with a month-on-month change.
Live gives you:
- Active sessions
- Average concurrent viewers
- Peak concurrent viewers
- Average watch time
- Average attributed sales per session
Replay gives you:
- Active replays
- Views
- Viewers
- Average watch time
- Total viewing time
Active sessions and Active replays count only the ones that drew viewers in the period. Empty broadcasts do not count.
Live performance or Replay performance — leaderboards, with sessions or replays on the left and best sellers on the right. Switch the ranking dimension above. Live offers Attributed sales, Conversion, and Engagement. Replay offers Attributed sales and Conversion only.
To see what replays contribute, read the live Performance page against the replay one.
The replay side has the same four blocks with replay data:
Details
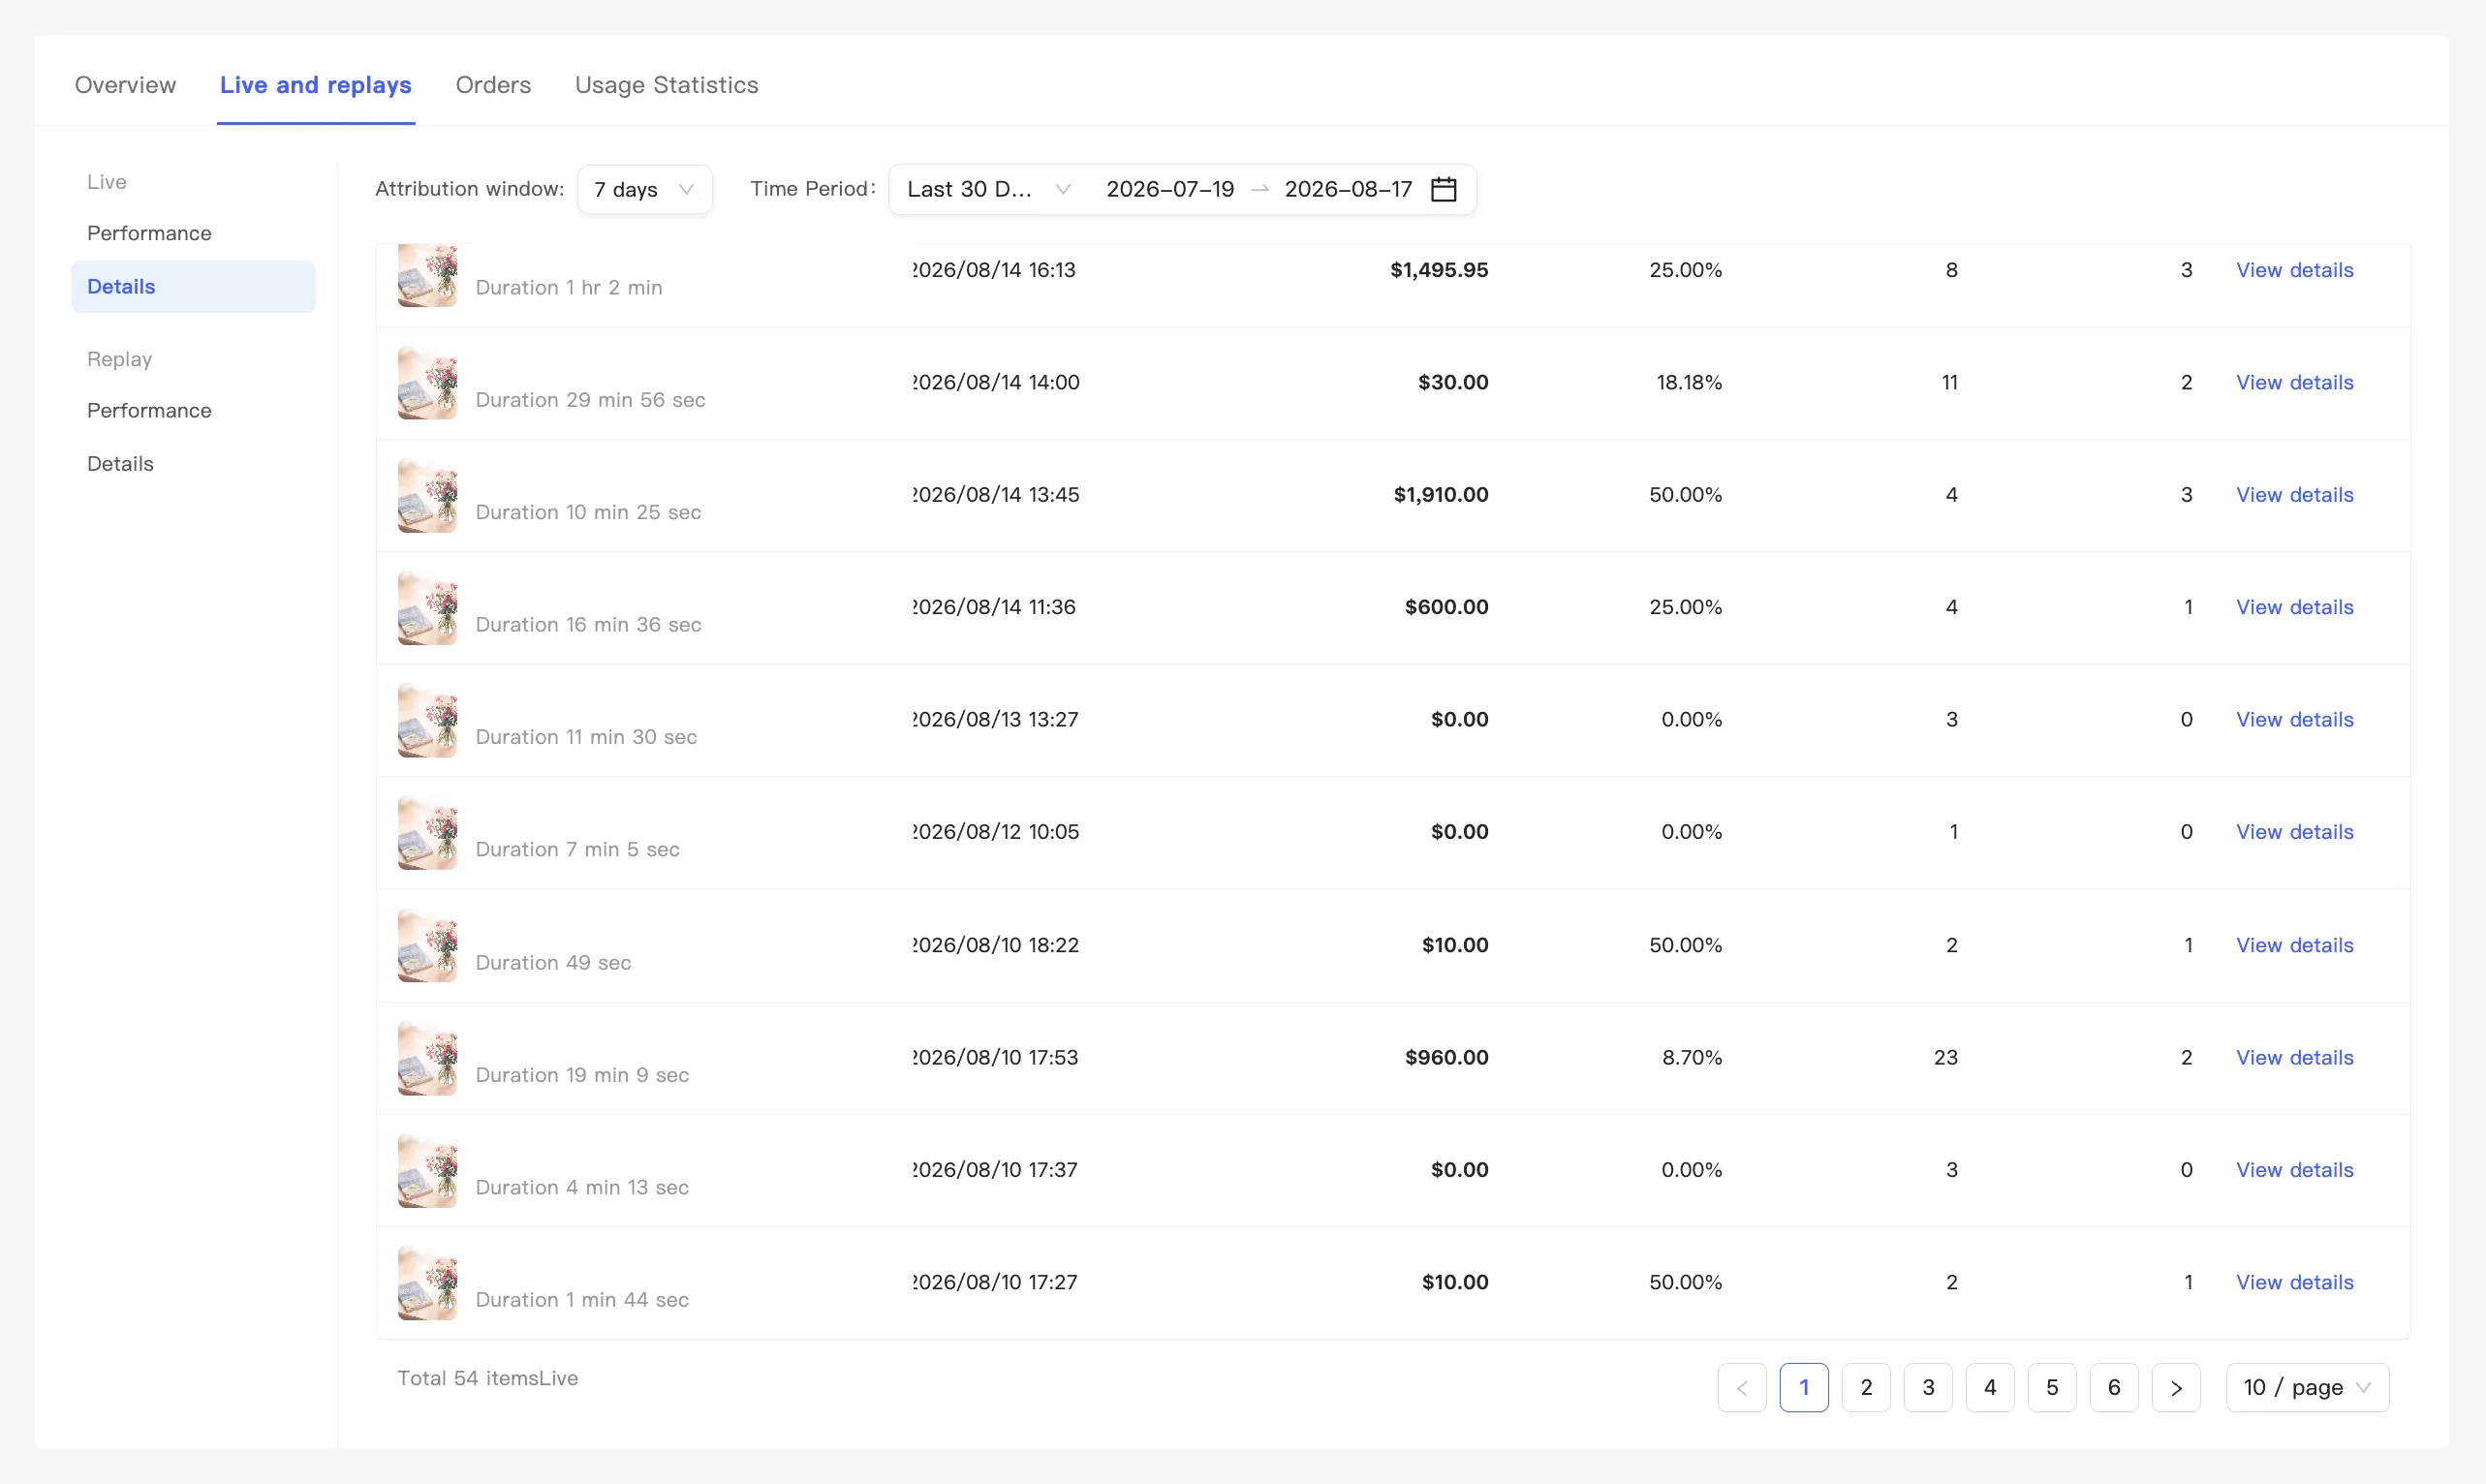
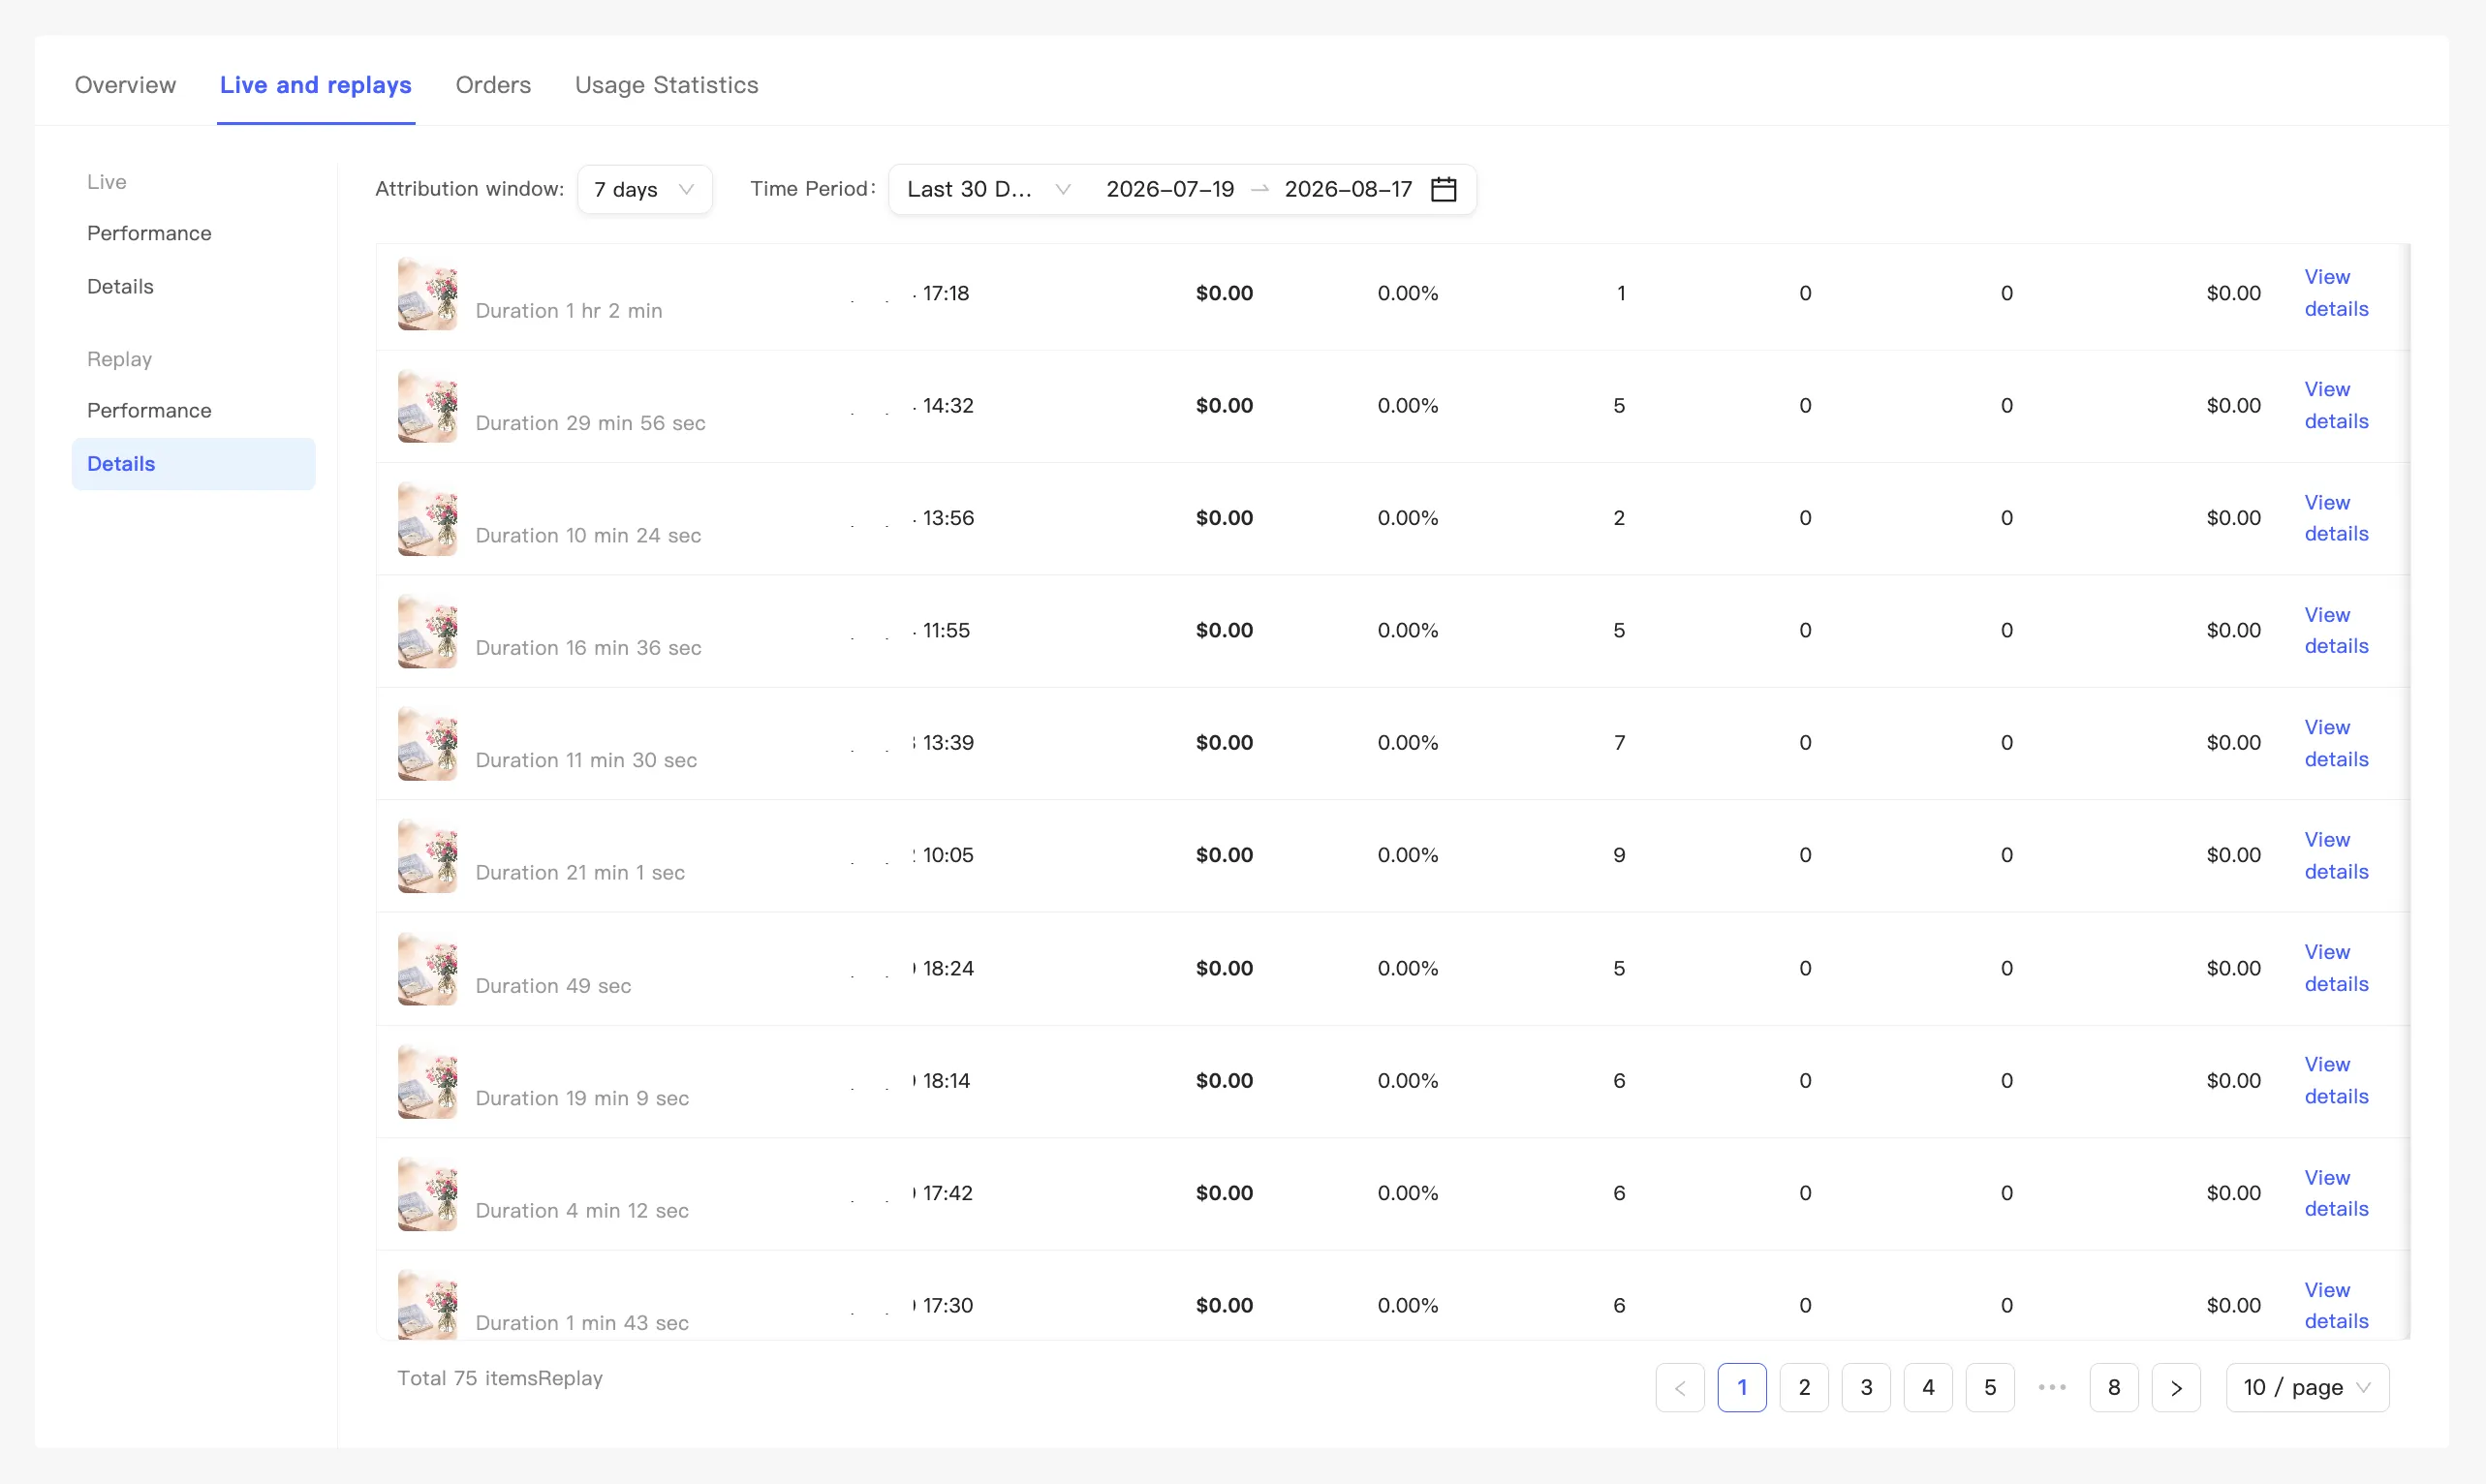
Section titled “Details”A table of every session and every replay.
Each row is one broadcast or one replay: cover, name, and Duration on the left, then the start time, then the numbers. For replays that time column shows the release time. Click a header to sort, and customize which columns appear.
Search by name above the table. Page through at the bottom, set how many rows per page, and read the total count.
View details at the end of a row opens that item’s full data: live goes to Single session data, replay goes to Single replay data.