Analytics overview
Analytics is where live and replay data comes together. This page covers the layout and the filters. Each block has its own article.
Four tabs
Section titled “Four tabs”| Tab | Contents |
|---|---|
| Overview | Totals and trends across every broadcast and replay |
| Live and replays | Per-session and per-replay detail |
| Orders | Orders attributed to your broadcasts |
| Usage Statistics | Quota consumption and top-up records |
Filters
Section titled “Filters”The filters at the top of the page apply to whichever tab you are on:
- Attribution window — how long after a broadcast an order still counts towards it. Seven days by default. See Attribution rules.
- Time Period — which stretch of time you are looking at. Presets run from today through the past 60 days, or set your own start and end dates.
The current time zone sits on the right, and every timestamp follows it.
The attribution window and the time period are different things. One decides how far forward orders count, the other decides which stretch you view. They are the easiest pair to confuse. See Attribution rules.
The overview tab
Section titled “The overview tab”Three blocks, top to bottom: key metrics, conversion analysis, and rankings.
Key metrics
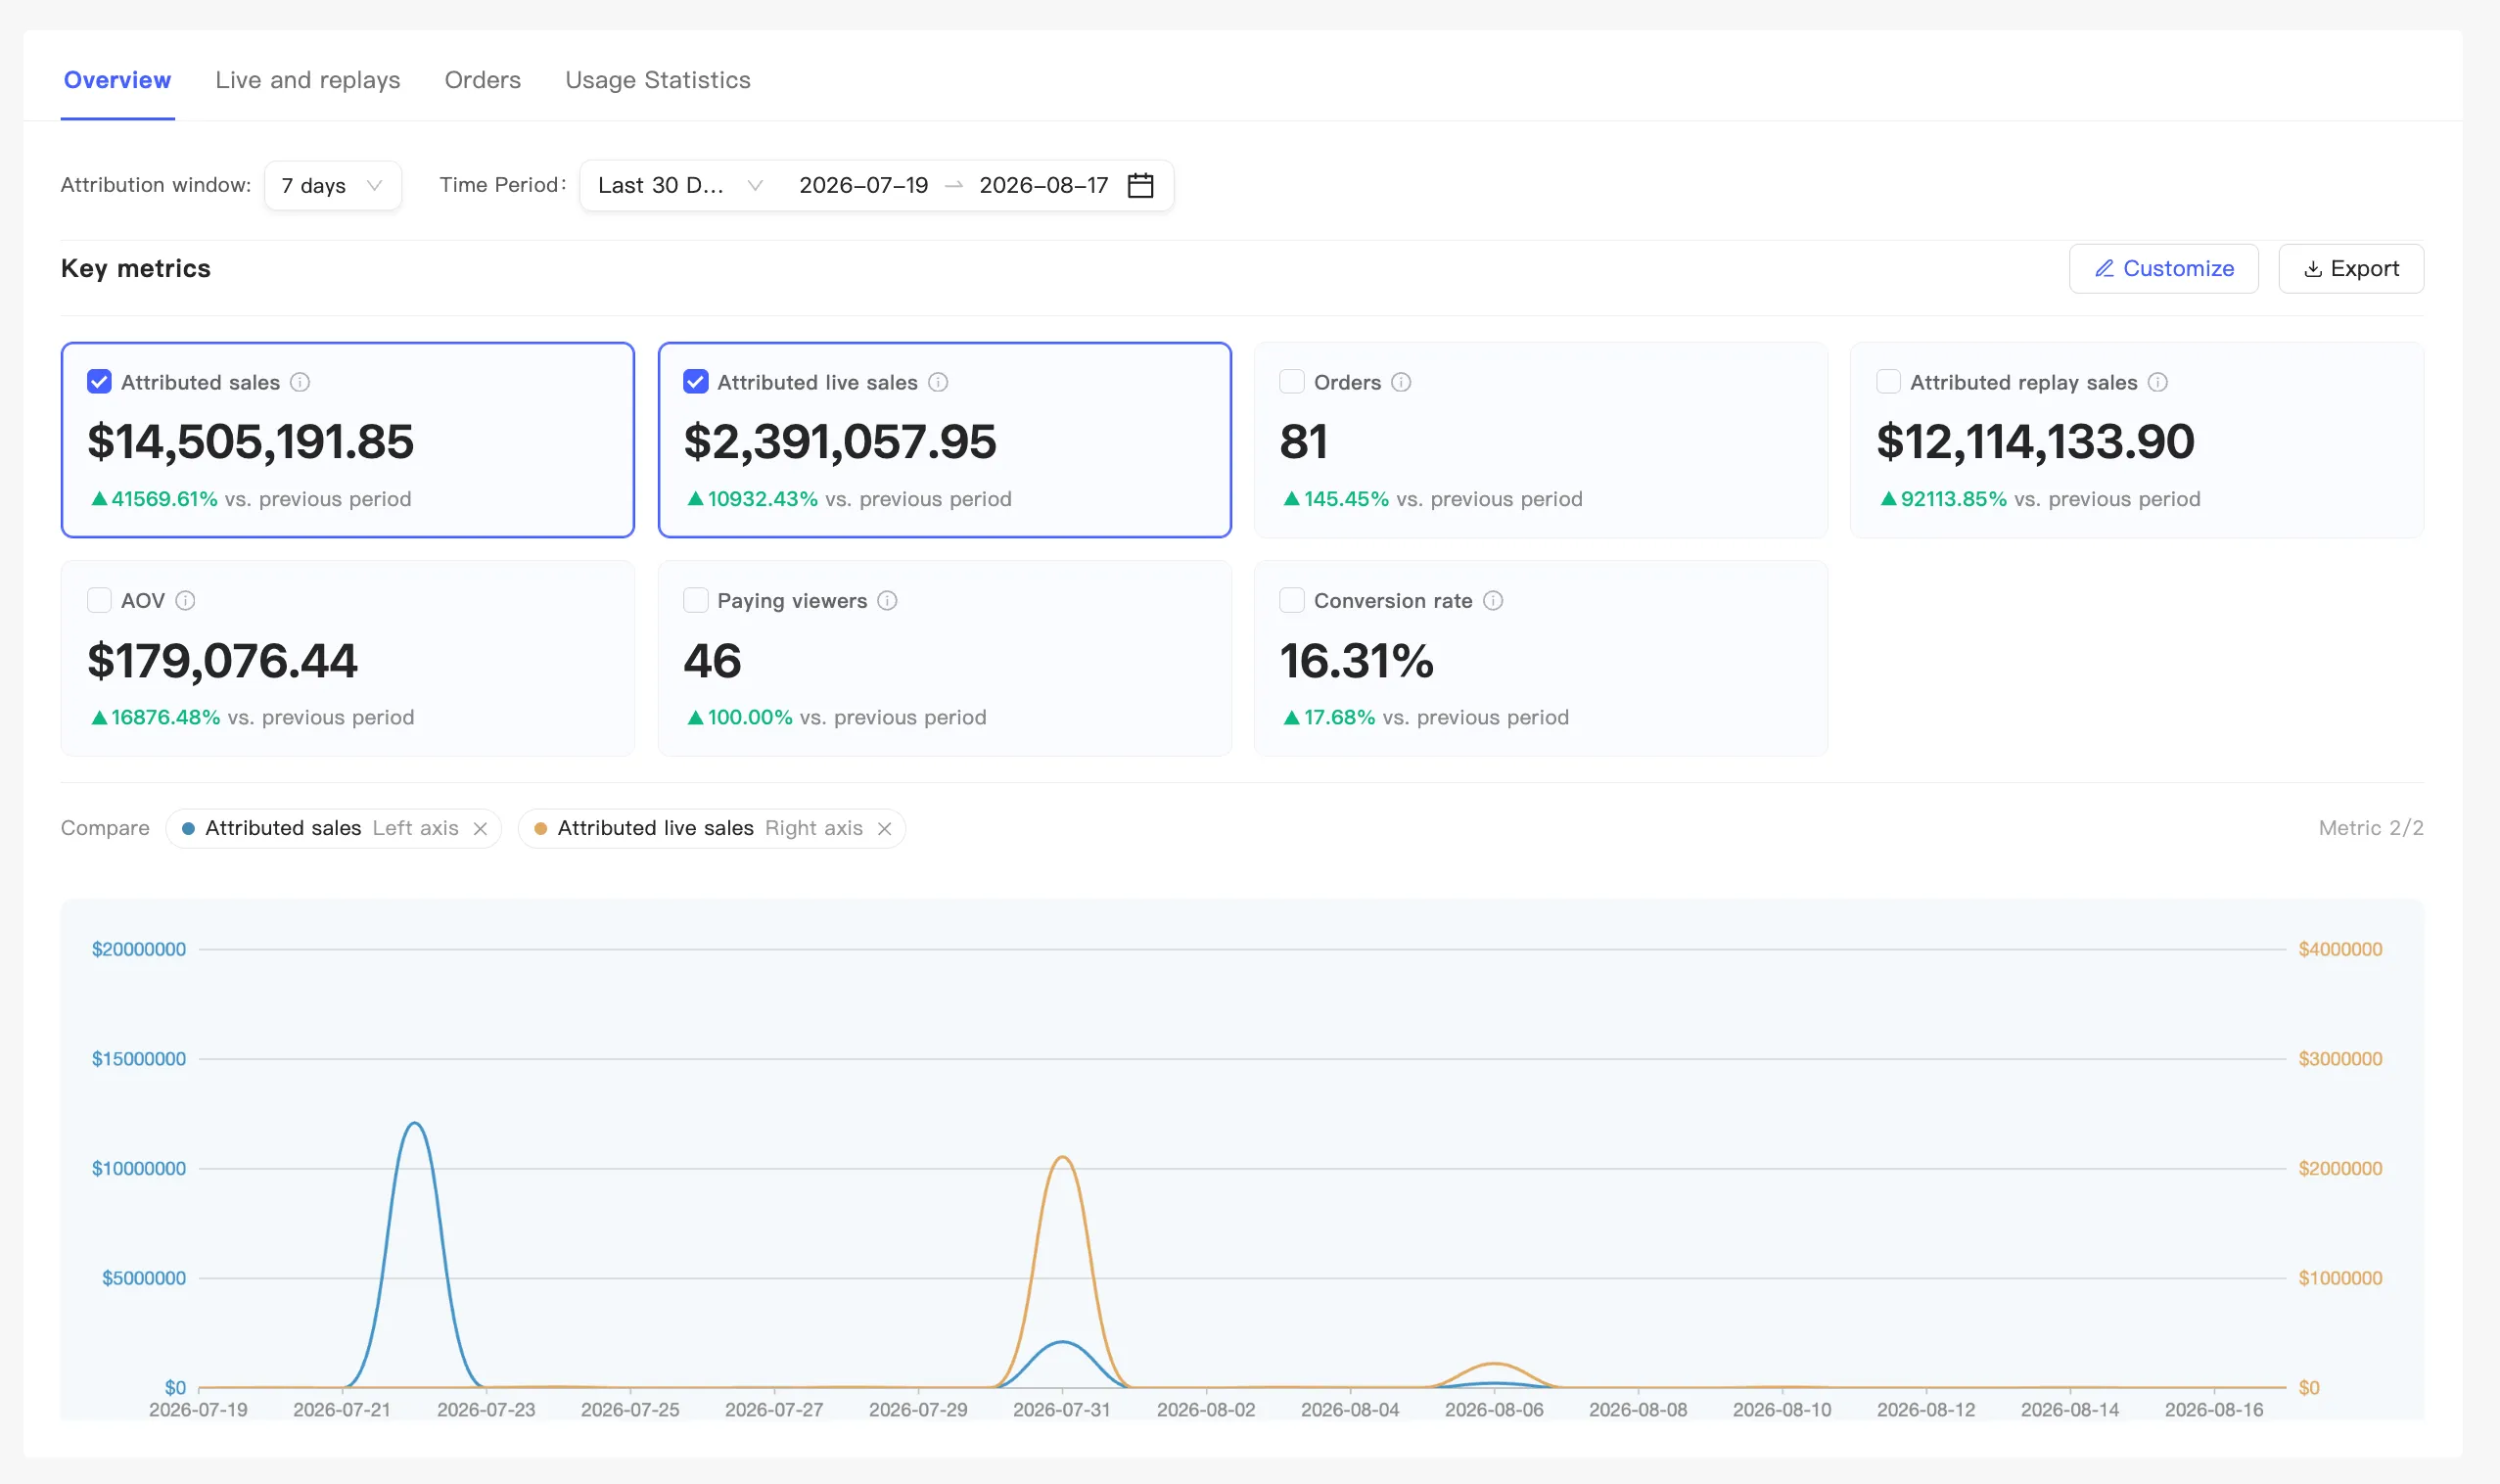
Section titled “Key metrics”A row of metric cards, each with its current value and a month-on-month change.
- Change which metrics — click Customize.
- Reorder them — drag the cards.
- See a trend — click a card to select it and the chart below plots it. Two at most, one at minimum. With two selected the rest go unselectable, and with one you cannot deselect it. The legend reads Metric N/2, and the two lines use the left and right axes.
- Export — Export queues an export task. See Export data.
Conversion analysis
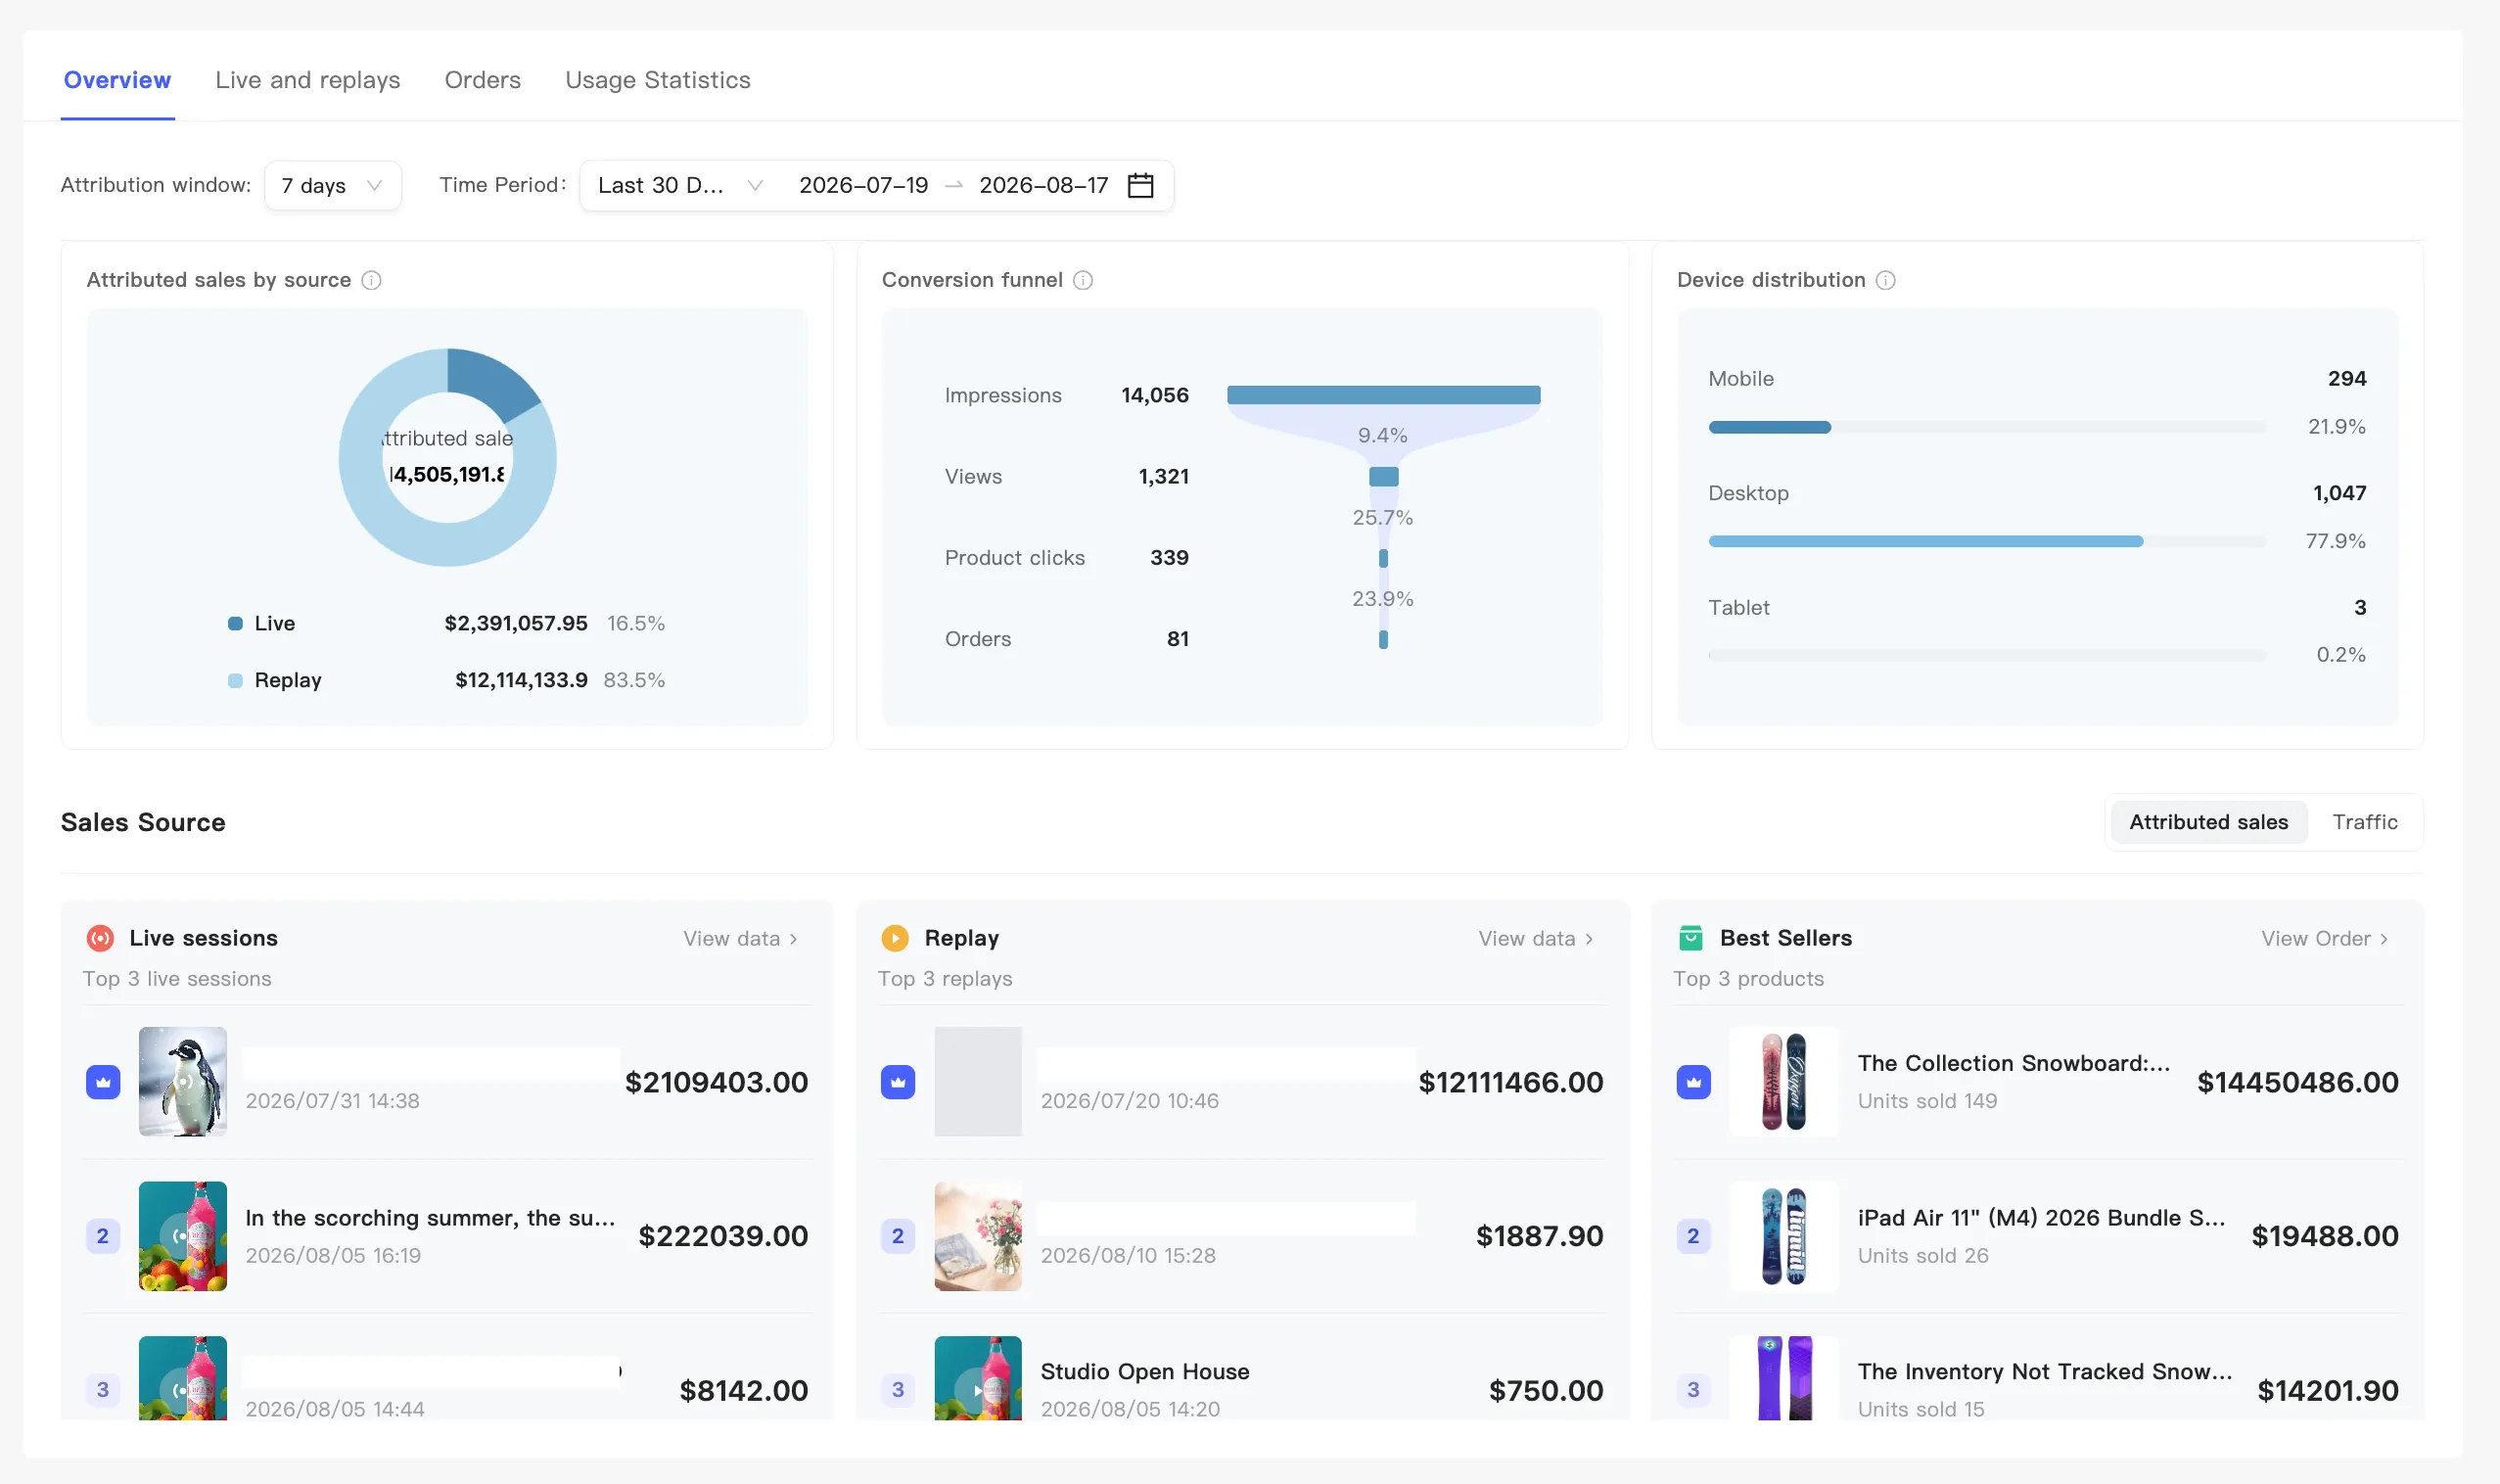
Section titled “Conversion analysis”Three cards side by side:
- Attributed sales by source — a donut that splits live from replay. Use it to see how much revenue replays carry.
- Conversion funnel — Impressions, Views, Product clicks, and Orders, with the rate between each step, so you can see which step loses the most.
- Device distribution — device share by views across live and replay together.
Rankings
Section titled “Rankings”Ranked by Attributed sales or Traffic, so your strongest sessions surface. Drill straight into one session from here. See Single session data.